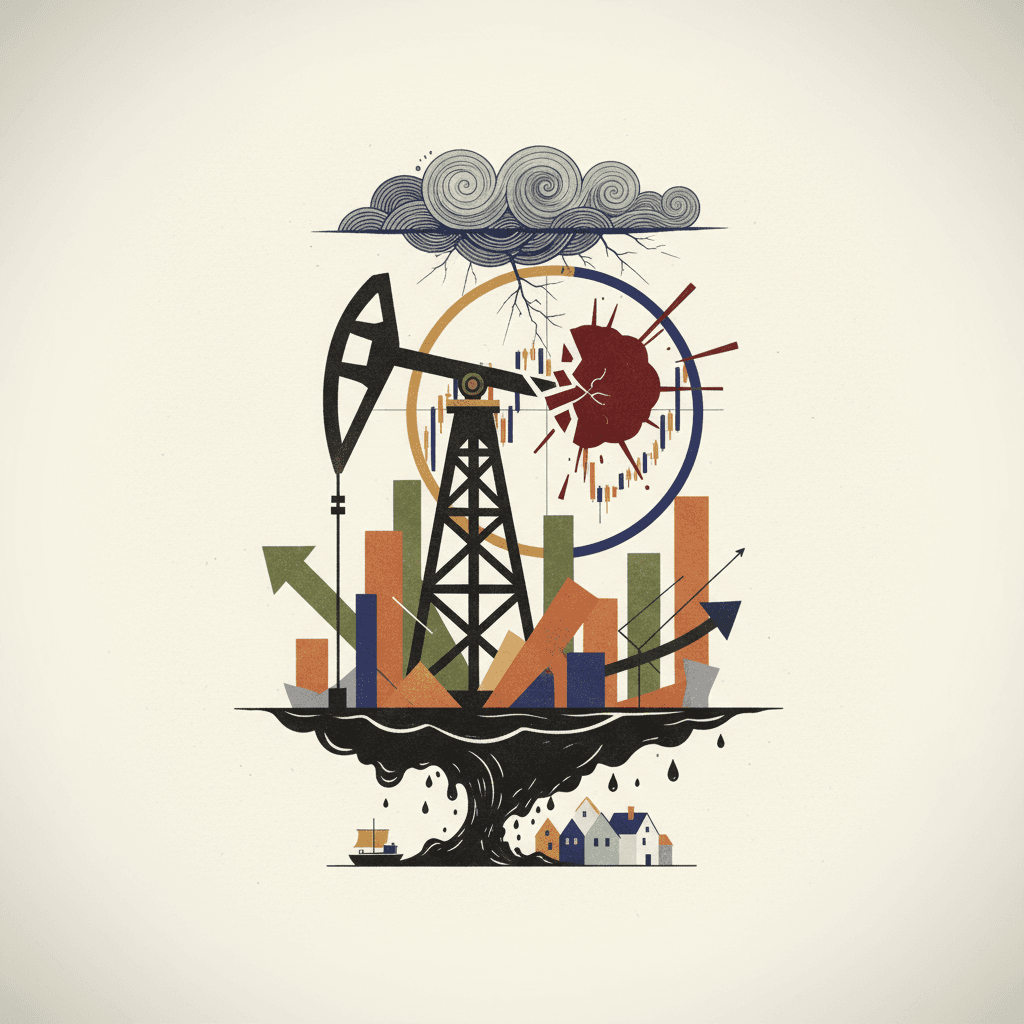
Prediction Markets Are Pricing a Middle East Oil Shock. Here's What That Means for Your Portfolio.
Something unusual is happening across prediction markets right now. A cluster of contracts covering oil prices, shipping lanes, Iranian diplomacy, and regional leadership changes are all moving in the same direction, and they're painting a picture of a Middle East crisis that could send oil prices sharply higher before any diplomatic resolution arrives.
Let's walk through the numbers, because they tell a story that matters whether you own energy stocks or just fill up your car.
The Oil Price Signal
Prediction markets currently assign a 76% chance that WTI crude oil (the U.S. benchmark) will hit at least $115 per barrel at some point before the end of 2026. That alone is notable, since WTI has been trading well below that level. But the tail-risk probabilities are what really stand out. There's a 38% chance of oil reaching $140, a 33% chance of hitting $150, a 27% chance of touching $160, and even a 17% chance of $180 oil.
To put $180 oil in perspective, that would be the highest price in the history of the WTI contract. A one-in-six probability of a record-shattering price is not something you normally see priced into markets. Something is driving this.
The Strait of Hormuz Is the Trigger
That something appears to be the Strait of Hormuz, the narrow waterway between Iran and Oman through which roughly 20% of the world's oil supply passes every day. Think of it as a two-lane highway carrying a fifth of the planet's energy. If that highway closes, or even if drivers start avoiding it, the ripple effects are enormous.
Prediction markets tracking shipping transit through Hormuz show a near-total collapse in confidence that things will return to normal anytime soon. The probability that the 7-day average of transit calls normalizes above 60 by April 15 is just 4%, and that number dropped 1.2 percentage points in the last 24 hours alone. Even extending the window to May 1 only gets you to 22%, which itself fell nearly 17 points recently.
This is not a theoretical risk. Ships are already avoiding the strait or paying dramatically higher insurance premiums to transit it. When tankers reroute around the southern tip of Africa instead of cutting through Hormuz, every voyage gets longer. Longer voyages mean fewer available ships, which means higher shipping rates, which means higher costs that eventually show up at the gas pump and in inflation data.
The Danger Window: Crisis Before Resolution
The Iran nuclear deal probabilities reveal something important about timing. Markets see a 51% chance of a new U.S.-Iran nuclear agreement by the end of 2026, but only a 9% chance by May and a 25% chance by June. The probability rises to 38% by August.
Read those numbers together and the story becomes clear: markets expect a period of maximum danger over the next few months, followed by a potential diplomatic off-ramp later in the year. The crisis comes first, then the resolution. That sequencing creates a tradeable window.
Adding to the regional instability, prediction markets give a 13.5% chance that Reza Pahlavi, the exiled son of Iran's last Shah, becomes Iran's next head of state, and a 17.5% chance he visits Iran before January 2027. The U.S. recognizing Pahlavi as Iran's leader sits at 13.5%. These aren't high probabilities individually, but the fact that regime change scenarios are even being actively traded tells you something about the range of outcomes people are preparing for. Meanwhile, Benjamin Netanyahu leaving as Israel's Prime Minister before January 2027 trades at 32.5%, adding another layer of regional uncertainty.
The Self-Reinforcing Loop
The danger with this kind of geopolitical pattern is that it can feed on itself. Here's how:
- Tensions around the Strait of Hormuz rise, causing ships to reroute or avoid the passage entirely.
- Fewer transits mean higher insurance premiums and longer voyages, which effectively tighten global oil supply even without a physical blockade.
- Tighter supply pushes oil prices higher.
- Higher oil prices increase the economic stakes for all parties, raising the risk of miscalculation.
- The threat of further escalation causes even more shipping avoidance, restarting the cycle.
This is the kind of feedback loop that can move prices much further than the underlying fundamentals would suggest, because each step amplifies the one before it.
What to Buy: The Shovels, Not Just the Gold
During the California Gold Rush, the people who most reliably made money weren't the miners. They were the people selling pickaxes, shovels, and denim jeans. The same principle applies to an oil shock. You can buy oil companies directly, but some of the most compelling opportunities are in the companies that provide the infrastructure and services that everyone in the industry needs, regardless of who "wins."
Direct Energy Exposure
XLE (Energy Select Sector SPDR ETF) gets a strong buy signal at 82% confidence. It's the most diversified way to play the oil spike thesis, holding ExxonMobil, Chevron, ConocoPhillips, and dozens of other energy companies. If oil hits $115 to $140, these companies generate enormous free cash flow that funds buybacks and dividends, creating a floor under the stock price even if oil eventually retreats.
FANG (Diamondback Energy) is a pure-play Permian Basin exploration and production company with breakeven costs around $40 per barrel. This is an asymmetric setup: if oil stays flat, Diamondback still generates solid cash flow. If oil spikes to $115 or beyond, the profit on every incremental barrel is extraordinary. The Permian Basin is the only place on earth that can meaningfully ramp up production quickly in response to a supply disruption, and Diamondback is one of its best operators. Buy signal at 77% confidence.
The Shovel Sellers: Tankers
STNG (Scorpio Tankers) is the strongest conviction infrastructure play at 85% confidence. When Hormuz transit collapses, tanker routes get dramatically longer as ships go around Africa instead. Longer routes mean more ton-miles, which means higher day rates for tanker companies. Scorpio operates one of the largest modern product tanker fleets in the world. The critical insight is that even the threat of Hormuz closure is already raising insurance premiums and forcing rerouting. You don't need an actual blockade for this trade to work.
INSW (International Seaways) plays a similar role but with more crude tanker exposure through larger vessel classes. If Persian Gulf crude must find alternative routes, or if buyers must source crude from further away to replace it, ton-miles increase either way. INSW has been aggressively returning capital to shareholders and trades at a low multiple to current earnings. Buy signal at 80% confidence.
The Shovel Sellers: Oil Services and Equipment
OIH (VanEck Oil Services ETF) holds Schlumberger, Halliburton, and Baker Hughes, the companies that actually do the drilling. When oil spikes, every producer wants to drill more, and they all need services companies to do it. These firms have been disciplined about spending, so their profit margins expand quickly when demand picks up. Buy signal at 78% confidence.
FTI (TechnipFMC) makes the subsea production systems, the physical equipment that sits on the ocean floor enabling deepwater drilling. It's one of only three major companies in the world that can do this, giving it near-oligopoly pricing power. Oil at $115 or higher makes marginal deepwater projects economically viable, expanding TechnipFMC's addressable market. Buy signal at 76% confidence, though the revenue uplift takes 12 to 24 months to materialize.
TDW (Tidewater) operates the world's largest fleet of offshore support vessels. Every offshore platform needs supply boats, anchor handlers, and logistics support. If oil stays elevated long enough to drive new offshore activity, Tidewater's earnings revision cycle is just beginning. Buy signal at 75% confidence, with the caveat that offshore activity typically lags oil prices by 6 to 12 months.
Pipeline Infrastructure
TRGP (Targa Resources) gathers, processes, and transports natural gas and natural gas liquids from the Permian Basin. Think of it as a toll road. When U.S. producers drill more oil in response to a global supply disruption, they also produce associated natural gas that has to go somewhere. Targa collects fees on that volume regardless of which E&P company is drilling. The dividend provides downside protection. Buy signal at 74% confidence.
A Speculative Addition
AMSC (American Superconductor) is a lower-confidence idea at 58%. The company provides grid-hardening solutions that governments tend to prioritize during energy crises. The connection to the Hormuz thesis is indirect, and AMSC is a small-cap company with volatile earnings. Consider it a speculative position at most.
The Risks Are Real
This thesis has several ways it can go wrong, and being honest about them is important.
The biggest risk is a quick Iran nuclear deal. At 51% probability by year-end, a diplomatic breakthrough could collapse the geopolitical premium in oil prices rapidly. Energy stocks often sell off at the first sign of diplomatic progress, not when an actual deal is signed.
The U.S. Strategic Petroleum Reserve could be deployed to cap prices temporarily, buying time and taking the edge off a spike. A global recession triggered by stagflation (the combination of high inflation and slow growth) could destroy oil demand enough to offset the supply disruption. This is the scenario where everyone loses.
The prediction market probabilities themselves deserve scrutiny. WTI reaching $115 at 76% seems extraordinarily elevated compared to what the futures market is pricing. These contracts may be thinly traded, and the probabilities could be unreliable.
For the tanker plays specifically, rates can swing 50% or more in a single quarter. A diplomatic headline can erase weeks of gains in a day. And for the longer-cycle infrastructure plays like TechnipFMC and Tidewater, a short-lived geopolitical spike won't generate enough sustained high prices to actually move the needle on offshore spending.
Finally, if oil does spike dramatically, windfall profit tax proposals could gain political traction, creating regulatory risk for producers.
Why This Matters
You don't need to trade a single stock for this pattern to affect you. If oil spikes to $115 or higher, gasoline prices follow. So do heating costs, shipping costs, and the price of anything that travels by truck, which is essentially everything at your grocery store. For anyone with a 401(k), energy holdings would benefit, but the broader market impact of an oil shock is usually negative, particularly for consumer discretionary stocks and airlines.
The prediction market data is telling us that the next few months represent a window of elevated risk before diplomacy potentially catches up. Whether you act on that signal by adjusting your portfolio or simply by understanding why gas prices might jump this summer, the information is worth having.
Analysis based on prediction market data as of April 9, 2026. This is not investment advice.
How This Story Evolved
First detected Mar 20 · Updated daily
The article's focus shifted from giving portfolio advice to readers to highlighting what experienced investors are paying attention to. The opening was also rewritten to lead with specific data points, like a 76% probability of oil hitting $115, instead of building up to the crisis picture more gradually.
Read latest →The headline was tweaked to sound less technical and more personal to everyday investors. The opening of the article was rewritten to ease readers in more gradually, adding context about the Strait of Hormuz before diving into the specific price predictions.
Read this version →The updated article adds specific probability numbers and price targets from prediction markets, such as a 73% chance oil hits $115 per barrel and a 16% chance it reaches a record $180. It also shifts from a general overview of market signals to leading with concrete data and trading volume to back up its claims.
Read this version →The article was updated to add more context about what's driving the predicted oil price spike, mentioning specific factors like shipping lanes, Iranian diplomacy, and regional leadership changes. The opening was also rewritten to be more detailed and conversational, and the article added clearer section headers.
The new version adds more specific details about what the prediction markets are tracking, naming the Strait of Hormuz, Iran nuclear talks, and Iranian regime change as examples. It also adds a claim that traditional financial news hasn't fully caught on to the story yet.
Read this version →