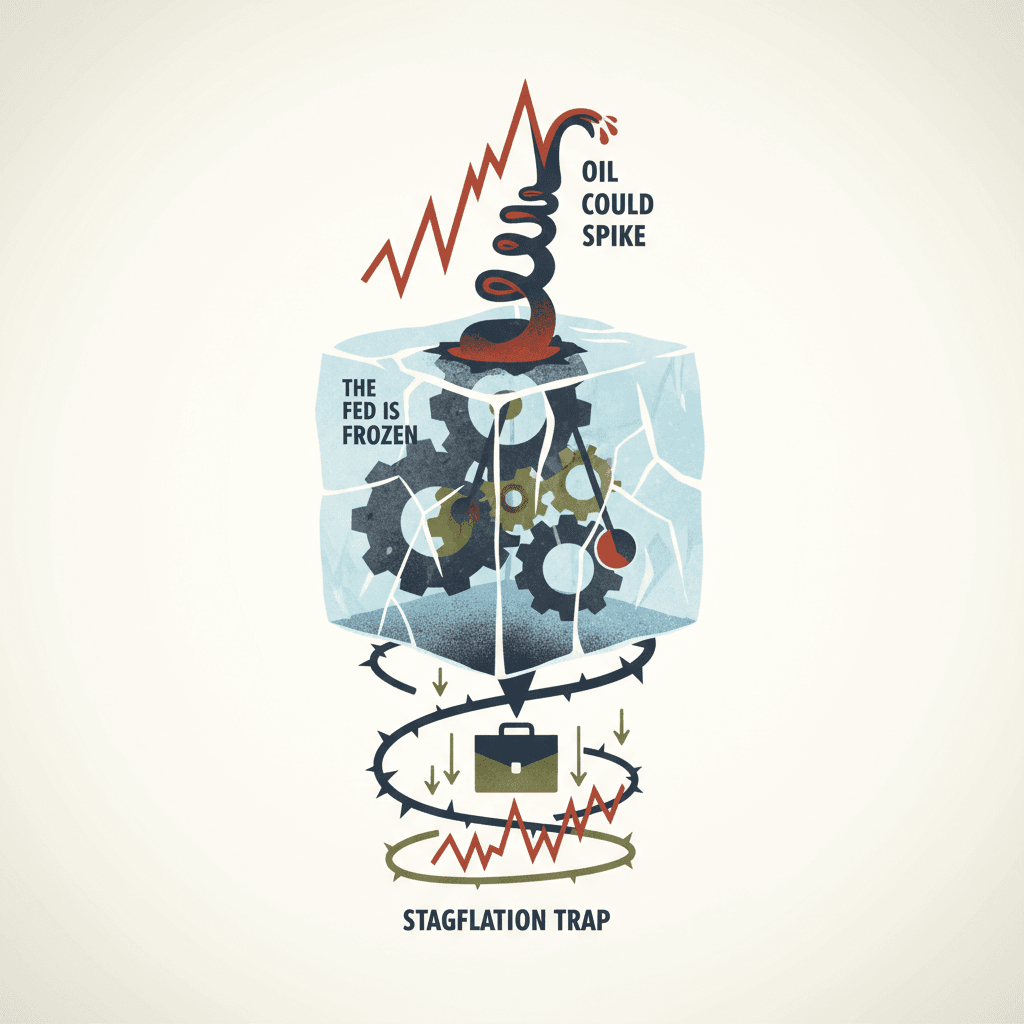
The Fed Is Frozen and Oil Could Spike: What the Stagflation Trap Means for Your Portfolio
Imagine you're driving a car with the steering wheel locked. The road is curving left because the economy is slowing down, and it's also curving right because prices keep climbing. You can't turn either way. That's the Federal Reserve right now, and prediction markets are putting hard numbers on just how stuck they are.
A Central Bank With Its Hands Tied
Betting markets are pricing a 98% probability that the Fed takes zero action at its April 2026 meeting. No rate hike, no rate cut, nothing. The chance of a 25 basis point cut (that's a quarter-percentage-point reduction in the interest rate the Fed charges banks) is just 1%. The chance of any hike? 0%. Looking further out, there's a 33-40% chance the Fed makes zero rate cuts for all of 2026. Not one.
At the same time, the probability of a recession in 2026 sits at 27-29%, and unemployment has a 36% chance of exceeding 5% before 2027. The economy is softening. Normally, the Fed would respond by lowering rates to make borrowing cheaper and stimulate spending. But they can't, because the other side of their job, keeping prices stable, is flashing red too.
WTI crude oil, the benchmark price for American oil, has a 31% chance of reaching $140 per barrel, a 25% chance of hitting $150, an 18% chance of touching $160, and a 17% chance of spiking to $180 by year-end. Oil at those levels would send gasoline, shipping, and manufacturing costs through the roof.
This is what economists call stagflation: stagnant growth combined with rising prices. It's the scenario that billionaire investor Ray Dalio has warned about for years. When the economic machine slows down while cost pressures stay elevated, the Fed's two mandates (maximum employment and stable prices) directly conflict with each other. Cutting rates would pour fuel on inflation. Raising rates would choke an already weakening economy. The result is paralysis.
How This Self-Reinforcing Trap Works
- Oil prices rise on geopolitical risk or supply constraints, pushing up costs for businesses and consumers.
- Higher costs slow consumer spending and squeeze corporate margins, raising recession odds.
- Rising recession risk would normally prompt the Fed to cut rates.
- But elevated oil prices keep inflation expectations high, preventing the Fed from cutting.
- The Fed stays frozen, offering no relief to the slowing economy.
- Economic weakness builds while inflation persists, reinforcing the stagflation cycle.
What the Numbers Mean for Markets
This environment is bearish for rate-sensitive assets like real estate, growth stocks, and highly leveraged companies. The S&P 500 has only about a 48% chance of finishing above 6845 by year-end, and the Nasdaq has a 17% chance of falling below 19,000. That's a wide distribution of outcomes with meaningful downside tail risk. Long-duration bonds face headwinds from persistent inflation expectations even as the economy weakens, which is the worst of both worlds for fixed-income investors.
Trade Signals: Gold Rushes and Shovel Sellers
During the California Gold Rush, the people who made the most reliable money weren't the miners. They were the ones selling shovels, picks, and blue jeans. The same logic applies here. In a stagflation environment, you want to own the infrastructure that benefits regardless of which specific scenario plays out.
BIL — BUY (Confidence: 82%) This is the ultimate parking spot when the Fed is frozen. BIL holds short-term Treasury bills, which are currently yielding around 4.25-4.50% with virtually zero risk of price decline. When prediction markets say there's a 98% chance the Fed does nothing and a 33-40% chance of zero cuts all year, those yields persist. You collect a real return while waiting for clarity. The risk? If the Fed surprises everyone with aggressive cuts, you miss the bond rally. And if inflation spikes above 4.5%, your real return turns negative. But as a shovel-seller play, BIL benefits from the exact scenario the data describes.
GLD — BUY (Confidence: 72%) Gold is the classic stagflation asset, and it works in every version of this story. If recession hits, gold acts as a safe haven. If oil spikes and inflation runs hot, gold acts as an inflation hedge. If the Fed stays paralyzed, the absence of rising real rates removes gold's biggest headwind. Central bank buying around the world provides a structural floor under prices. The catch is that gold has already rallied enormously and may be overbought. It also pays no yield, which matters when T-bills are giving you 4.5%. A sudden shift to risk-on sentiment could trigger rotation out of gold into equities.
XLE — BUY (Confidence: 68%) Energy is the clearest beneficiary because energy companies ARE the inflation. They don't suffer from rising oil prices, they profit from them. At current oil prices around $60-70, these companies already generate substantial free cash flow. At $140, it's a windfall. Historically, energy stocks have outperformed during stagflationary periods for exactly this reason. The risk is real, though: 69% of the time, oil stays below $140 in these markets. A recession would crush oil demand. OPEC+ could open the taps. And political risk from windfall profit taxes or strategic petroleum reserve releases could cap upside.
OIH — BUY (Confidence: 66%) This is the purest shovel-seller play in the energy space. OIH holds oilfield services companies like Schlumberger, Halliburton, and Baker Hughes. These are the companies that provide the drilling rigs, pressure pumping equipment, and completion services that every oil producer needs. If oil spikes, producers rush to drill more wells, and services companies get paid regardless of which producer wins. Even without a spike, current prices support steady drilling activity. The risk is that in a recession, drilling collapses no matter what oil costs. And if the oil spike comes from geopolitics like a war or embargo, it might not translate into more US drilling activity.
PDBC — BUY (Confidence: 65%) Broad commodity exposure is the diversified version of the stagflation hedge. PDBC holds a basket across energy, metals, and agriculture, meaning it doesn't depend on any single commodity spiking. When the Fed is broken and real assets outperform financial assets, this is the Dalio all-weather approach. The downside is that commodity futures ETFs suffer from something called contango, where the cost of rolling from one futures contract to the next slowly eats away at returns. A deflationary recession would crush all commodities simultaneously, and a strong dollar from risk-off flows would act as an additional headwind.
CTRA — BUY (Confidence: 64%) Coterra Energy is a diversified exploration and production company with significant exposure to both oil (Permian Basin) and natural gas (Marcellus Shale). The dual exposure acts as a natural hedge: if oil spikes on geopolitics but natural gas stays cheap, or vice versa, Coterra still benefits from one leg. Low breakeven costs and a strong balance sheet mean the company survives even if commodities stay flat. The risk is typical of mid-cap energy stocks, which can swing 30-40% in selloffs. Natural gas oversupply could weigh on half the business, and management could destroy value with poorly timed acquisitions.
SH — BUY (Confidence: 62%) SH is an inverse S&P 500 ETF, meaning it goes up when the market goes down. In a stagflation trap where equities face slowing growth, persistent cost pressures, and a Fed that can't ride to the rescue, this provides direct downside protection. The confidence is moderate, not high, because the recession probability is still only around 29%. The majority scenario remains no recession. Inverse ETFs also suffer from daily rebalancing decay, a mechanical drag that erodes returns over time, making them poor choices for long-term holds. A sudden geopolitical resolution that collapses the oil risk premium could spark a market rally that punishes this position.
TLT — NEUTRAL (Confidence: 45%) Long-duration Treasury bonds are caught in a brutal crossfire. In a normal slowdown, bonds rally as investors flee to safety and the Fed cuts rates. But when inflation stays hot because of oil, the Fed can't cut, which caps bond upside. The 33-40% chance of zero cuts in 2026 means yields may stay elevated even while the economy weakens. TLT has a duration of 17+ years, meaning small changes in yield create massive price swings. This is genuinely unclear, not a hidden buy or sell.
BILL — SELL (Confidence: 58%) This is the inverted shovel-seller logic. Bill.com provides financial automation software to small and medium businesses. In stagflation, these are the most vulnerable companies: squeezed by rising input costs from oil while getting no relief from frozen interest rates. BILL's revenue depends on SMB transaction volumes and customer growth, both of which contract sharply when small businesses are hurting. Think of it as selling the picks when the miners are packing up and going home. The risk is that SMBs might be more resilient than expected (there's still a 70%+ chance of no recession), and BILL may already be priced for a slowdown after previous selloffs.
Why This Matters for Your Money
If you have a 401(k), a savings account, or just buy groceries, this pattern touches your life. A frozen Fed means the interest rate on your savings account stays roughly where it is, which is actually decent news for savers. But it also means mortgage rates aren't coming down, so if you're looking to buy a home or refinance, relief isn't on the horizon. If oil spikes, you'll feel it at the gas pump, at the grocery store (shipping costs flow into food prices), and in your heating bill. And if the economy tips into recession while prices stay high, that's the scenario where paychecks get tighter and everything still costs more. The prediction markets aren't saying this is guaranteed. They're saying the odds of this uncomfortable outcome are high enough to take seriously.
The Risks Worth Repeating
The most important thing to remember is that the base case is still not a recession. A 27-29% recession probability means there's a 71-73% chance the economy avoids one entirely. The oil spike to $140+ has a 31% probability, which means there's a 69% chance it doesn't happen. Fed paralysis could be interpreted by markets as stability rather than crisis, and equities could rally on that perceived calm. A sudden geopolitical resolution, whether in the Middle East, between Russia and Ukraine, or in trade negotiations, could collapse the oil risk premium overnight and change the entire picture. Inverse ETFs decay over time. Commodity ETFs underperform physical commodities. Gold pays no income. Every signal here carries real risk, and the pattern may be overstating the confluence by combining what are individually still tail-risk probabilities.
The value of this analysis isn't that it predicts one outcome. It's that it maps the probabilities across multiple interconnected markets and helps you position for a range of scenarios rather than betting everything on one story.
Analysis based on prediction market data as of April 9, 2026. This is not investment advice.
How This Story Evolved
First detected Mar 20 · Updated daily
The headline was updated to highlight prediction markets as the source for stagflation concerns, replacing the mention of a slowing economy. The article's body made mostly small wording tweaks, like changing "serious" to "significant" and updating a subheading, but the overall meaning stayed the same.
Read latest →The headline was slightly reworded to make it flow more naturally, but the meaning stayed the same. The opening analogy changed from a car with stuck pedals to one with an overheating engine and failing brakes, and the article now more directly mentions the impact on personal portfolios.
Read this version →The article's opening was rewritten to start with a car analogy to make the Fed's situation easier to picture, before getting into the prediction market data. The new version also jumps more quickly into specific numbers, like the 98% probability of no Fed action, while the old version eased into the topic more gradually.
Read this version →The new version removed the car overheating analogy that opened the article and jumped straight into explaining the situation. It also added a clearer, simpler definition of stagflation early on for readers who may not know the term.
Read this version →The stagflation story stayed largely the same, but the focus sharpened — concerns about a slowing economy were dropped from the headline, leaving oil prices and the Fed's inability to act as the main worries. Investors appear to be moving toward energy and short-term safe assets while pulling back from longer-term bonds and some previous energy plays.
Read this version →The article updated its car analogy to better illustrate a "stagflation trap," where both action and inaction cause harm. The headline and framing now explicitly highlight a slowing economy alongside the frozen Fed and oil threat, painting a more complete picture of stagflation risks.
Read this version →The article updated its car analogy from a stuck gas pedal and brake to one where both pedals cause damage, making the Fed's situation sound even more dangerous. The headline also changed to more directly warn readers about the impact on their portfolio.
Read this version →The article swapped out the overheating car analogy for a locked steering wheel analogy to describe the Fed's situation. The section header also changed from "The Fed Can't Move" to "A Central Bank With Its Hands Tied," but the core message and statistics stayed the same.