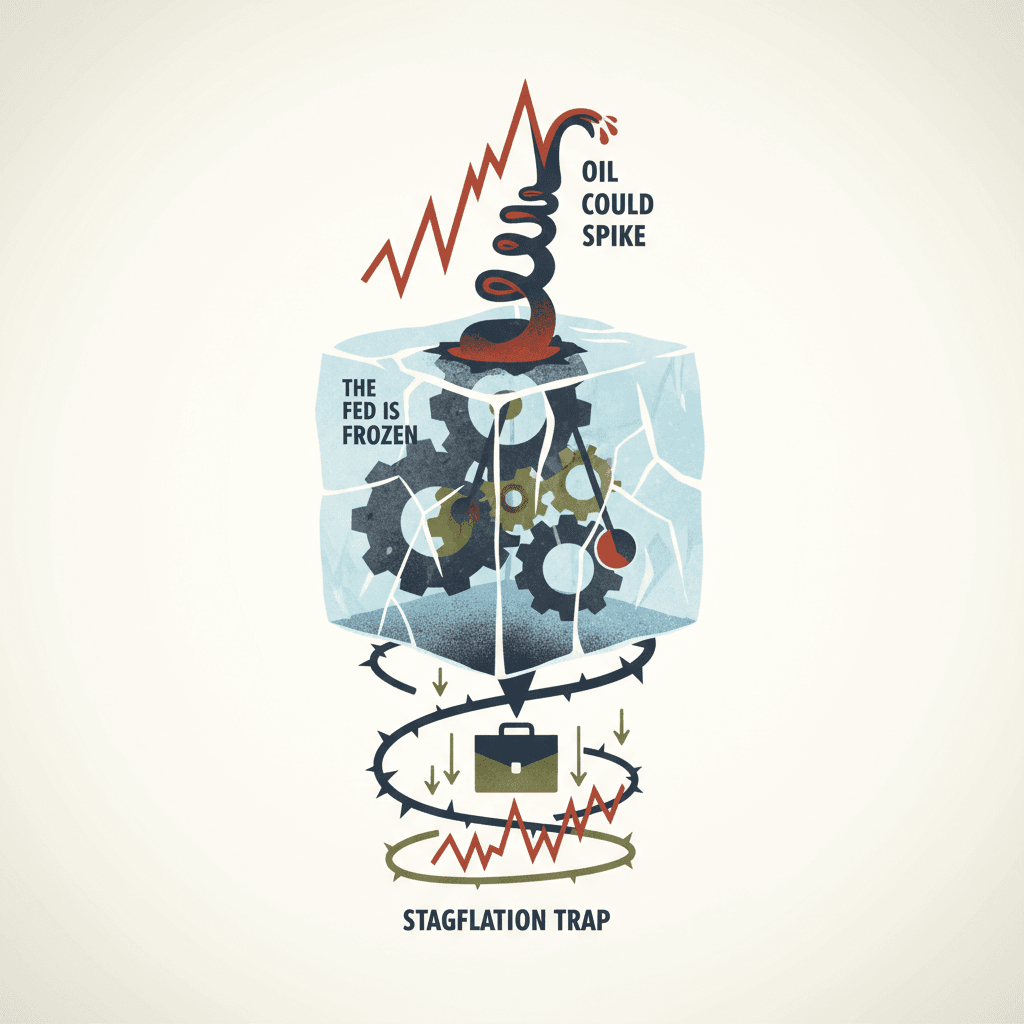
The Fed Is Frozen, Oil Could Spike, and the Economy Is Slowing. That's Called Stagflation.
Prediction markets are painting a picture right now that should make anyone with a 401(k) pay attention. The Federal Reserve, the institution responsible for keeping both inflation and unemployment in check, appears completely stuck. And the economic backdrop forming around that paralysis looks a lot like the nightmare scenario economists call stagflation: prices rising while the economy slows down.
Let's start with what the betting markets are actually telling us, because the numbers are striking.
The Fed Can't Move
There is a 98% probability that the Fed takes no action at its April 2026 meeting. Not a rate hike, not a rate cut, nothing. The chance of a 25 basis point cut (that's a quarter-percent reduction in the benchmark interest rate) sits at just 1%. The chance of any hike at all is 0%. Even looking ahead to June, the probability of a 25 basis point cut is only 9%.
Zoom out further and the picture stays frozen. There's a 33% chance the Fed makes zero rate cuts for all of 2026. Not one. Think of the Fed like a thermostat that's supposed to keep the house comfortable. Right now, the thermostat is broken. It can't turn the heat up and it can't turn it down.
Why? Because the two things the Fed is supposed to manage, inflation and employment, are pulling in opposite directions.
The Slowdown Side
Prediction markets put the probability of a recession in 2026 at 27%. That might sound low, but consider that in normal times this number hovers around 10-15%. Nearly one in three is not something to brush off. Meanwhile, there's a 39% chance that unemployment climbs above 5% before 2027. That would represent a meaningful jump from current levels and would signal real pain in the job market.
The Inflation Side
At the same time, oil prices carry serious upside risk. There's a 31% probability that WTI crude (the benchmark price for U.S. oil) hits $140 or higher by year-end. A 25% chance it reaches $150. An 18% chance it hits $160. And a 17% chance it touches $180. Oil currently trades around $60-70 a barrel, so these numbers represent a potential doubling.
Oil prices flow through to everything. Gasoline, shipping costs, food production, plastics, chemicals. When oil spikes, it acts like a tax on the entire economy. And it's exactly the kind of inflation the Fed can't fix by raising rates, because higher rates don't create more oil.
The Stagflation Trap: A Self-Reinforcing Cycle
This is where understanding the loop makes everything click:
- Oil prices rise, pushing up costs across the economy.
- Higher costs squeeze businesses and consumers, slowing economic growth.
- The slowing economy would normally prompt the Fed to cut rates to stimulate activity.
- But cutting rates risks pouring gasoline on the inflation fire that oil already lit.
- So the Fed sits still, unable to help the economy or fight inflation.
- The economy continues to slow under the weight of high costs with no monetary relief.
Ray Dalio, the founder of the world's largest hedge fund, has written extensively about this exact dynamic. He calls it a situation where the "economic machine" breaks down because the usual levers stop working. The Fed's dual mandate, keeping prices stable while maximizing employment, becomes impossible to fulfill when both problems exist simultaneously.
What This Means for Markets
The implications are bearish for what are called rate-sensitive assets, meaning anything that benefits from low or falling interest rates. That includes real estate, high-growth technology stocks, and heavily leveraged companies that need cheap debt to survive. The S&P 500 has only about a 48% chance of being above 6845 by year-end, and the Nasdaq has a 17% chance of falling below 19,000. That's a wide range of outcomes with real downside risk.
Long-duration bonds, like 20-year Treasuries, face an especially brutal crossfire. Normally they rally when the economy weakens because investors flee to safety. But persistent inflation expectations from potential oil spikes prevent the Fed from cutting, which caps how much bond prices can rise. They get neither the safety bid nor the rate-cut tailwind.
The Trades: Shovels, Gold, and a Parking Spot
When the Gold Rush hit California in 1849, most miners went broke. The people who made reliable money were the ones selling shovels, pickaxes, and denim jeans. That same logic applies here. Instead of betting on which specific outcome materializes, several of these positions profit from the underlying environment itself.
BIL — Short-Term Treasury Bills (BUY, 82% confidence)
This is the highest-conviction idea and it's almost boring, which is the point. When the Fed is frozen at current rates, short-term T-bills lock in roughly 4.25-4.50% yield with virtually zero risk from interest rate swings. Think of it as a well-paid parking spot for your money while you wait for the fog to clear. It benefits from the exact scenario prediction markets describe: a stuck Fed means these yields persist. The risk is opportunity cost. If stocks rally 20%, your 4.5% looks modest. And if inflation spikes above your yield, your real purchasing power actually shrinks.
GLD — Gold (BUY, 72% confidence)
Gold is the classic stagflation asset. It benefits from every version of this scenario. If recession hits, gold is a safe haven. If inflation spikes through oil, gold is an inflation hedge. If the Fed stays frozen, the absence of higher real interest rates (gold's biggest enemy) removes its main headwind. Central bank buying around the world provides a structural floor under demand. The catch: gold has already had an enormous run and pays no income. In a world where T-bills yield 4.5%, holding a shiny metal that generates zero cash flow has a real cost.
XLE — Energy Sector ETF (BUY, 68% confidence)
Energy stocks are the clearest beneficiary of the stagflation pattern because they ARE the inflation. Oil and gas companies generate massive free cash flow at current prices and would see windfall profits if oil approaches $140. Historically, energy stocks outperform during stagflationary periods precisely because their revenues rise with the same prices that are crushing everyone else. Even without a spike, current valuations and cash flows provide a floor.
OIH — Oil Services ETF (BUY, 66% confidence)
This is the shovels play for the oil patch. Companies like Schlumberger, Halliburton, and Baker Hughes provide the drilling rigs, pressure pumping, and completion services that every oil producer needs. If oil prices spike, producers rush to drill more, and they all need to rent the same equipment. OIH benefits regardless of which oil company wins because it supplies all of them.
PDBC — Broad Commodities ETF (BUY, 65% confidence)
When the monetary system is broken, real assets (things you can touch) tend to outperform financial assets (things on a screen). PDBC provides diversified exposure across energy, metals, and agriculture, hedging against the inflation side of stagflation without betting on any single commodity.
CTRA — Coterra Energy (BUY, 64% confidence)
Coterra is a diversified oil and gas producer operating in the Permian and Marcellus basins. Its mix of oil and natural gas provides a natural hedge: if oil spikes on geopolitics but gas stays cheap, or the reverse, the company has revenue from both sides. A strong balance sheet and low breakeven costs mean it can survive even if prices stay flat.
SH — Inverse S&P 500 ETF (BUY, 62% confidence)
A direct hedge against the broader market declining. With the Fed paralyzed, recession odds at 27-29%, and oil threatening cost pressures, the S&P faces a toxic mix. Confidence is moderate rather than high because the recession probability is still only about 30%, meaning a soft landing remains the most likely single outcome. Also important: inverse ETFs rebalance daily, which creates a drag on returns over time. They work as short-term hedges, not long-term holdings.
TLT — Long-Term Treasury Bonds (NEUTRAL, 45% confidence)
Long bonds are genuinely stuck. The risk/reward is unclear in both directions. A recession would send them soaring 15-20%. An inflation spike would push them lower. With the Fed frozen, there's no policy catalyst either way. This isn't a hedge or a cop-out. It's an honest assessment that the signal is too noisy to trade.
BILL — Bill Holdings (SELL, 58% confidence)
This is the shovels logic inverted. BILL provides financial automation software to small and medium businesses, the segment of the economy most vulnerable to stagflation. When input costs rise (oil spikes) and credit relief doesn't come (no rate cuts), small businesses cut spending, reduce transactions, and sometimes close entirely. BILL's revenue depends on exactly the kind of SMB activity that stagflation crushes. That said, confidence is moderate because there's still a 70%+ chance no recession materializes, BILL may already be priced for a slowdown, and company-specific good news could override the macro.
The Risks You Need to Understand
Every one of these positions carries meaningful risk, and intellectual honesty demands laying them out clearly.
The single biggest risk is that the base case is still no recession. A 27-29% probability means roughly 70% of scenarios involve the economy muddling through. Markets could interpret the Fed's inaction as stability rather than paralysis, and stocks could rally on perceived calm.
On the oil side, a 31% probability of $140+ means a 69% probability it stays below that level. OPEC+ could increase production. A diplomatic resolution to geopolitical tensions could collapse the risk premium overnight. An actual recession would destroy oil demand and crush energy stocks regardless of supply tightness.
For gold, the enormous rally already in the books means crowded positioning and overbought conditions. A strong risk-on move in equities could trigger rotation out of gold. And if the Fed eventually does hike rates, rising real yields would be devastating.
Inverse ETFs like SH suffer from daily rebalancing decay, which means they lose value over time even if the market goes sideways. They are tools for tactical hedging, not buy-and-hold investments.
And commodity ETFs like PDBC face a technical problem called contango, where the cost of rolling futures contracts forward quietly eats into returns over time.
Why This Matters for Your Everyday Life
If you have a 401(k) with a standard mix of stocks and bonds, the stagflation scenario is uniquely painful because both sides of that portfolio can lose simultaneously. Stocks fall because the economy weakens. Bonds fall because inflation stays elevated. The traditional "balanced portfolio" assumes those two things don't happen at the same time, but stagflation breaks that assumption.
On a more practical level, if oil does spike toward $140-180, you'll feel it at the gas pump immediately, at the grocery store within weeks, and in your heating bill within months. The Fed being unable to respond means there's no cavalry coming. No rate cuts to stimulate growth. No rate hikes to cool prices. Just a long, uncomfortable period of elevated costs and a softening job market.
The prediction market data, with over $16 million in trading volume across these contracts, suggests this isn't a fringe view. Real money is pricing in a meaningful probability that the economic machine is, for the moment, broken.
Analysis based on prediction market data as of April 9, 2026. This is not investment advice.
How This Story Evolved
First detected Mar 20 · Updated daily
The headline was updated to highlight prediction markets as the source for stagflation concerns, replacing the mention of a slowing economy. The article's body made mostly small wording tweaks, like changing "serious" to "significant" and updating a subheading, but the overall meaning stayed the same.
Read latest →The headline was slightly reworded to make it flow more naturally, but the meaning stayed the same. The opening analogy changed from a car with stuck pedals to one with an overheating engine and failing brakes, and the article now more directly mentions the impact on personal portfolios.
Read this version →The article's opening was rewritten to start with a car analogy to make the Fed's situation easier to picture, before getting into the prediction market data. The new version also jumps more quickly into specific numbers, like the 98% probability of no Fed action, while the old version eased into the topic more gradually.
Read this version →The new version removed the car overheating analogy that opened the article and jumped straight into explaining the situation. It also added a clearer, simpler definition of stagflation early on for readers who may not know the term.
The stagflation story stayed largely the same, but the focus sharpened — concerns about a slowing economy were dropped from the headline, leaving oil prices and the Fed's inability to act as the main worries. Investors appear to be moving toward energy and short-term safe assets while pulling back from longer-term bonds and some previous energy plays.
Read this version →The article updated its car analogy to better illustrate a "stagflation trap," where both action and inaction cause harm. The headline and framing now explicitly highlight a slowing economy alongside the frozen Fed and oil threat, painting a more complete picture of stagflation risks.
Read this version →The article updated its car analogy from a stuck gas pedal and brake to one where both pedals cause damage, making the Fed's situation sound even more dangerous. The headline also changed to more directly warn readers about the impact on their portfolio.
Read this version →The article swapped out the overheating car analogy for a locked steering wheel analogy to describe the Fed's situation. The section header also changed from "The Fed Can't Move" to "A Central Bank With Its Hands Tied," but the core message and statistics stayed the same.
Read this version →